One second. One summary.
Open, high, low, and close describe the interval. They cannot reconstruct the original trade count or the order of trades within it.
FUTURES CHARTING · BUILT FROM TICKS
Your candles should start with trades. LASER brings tick-driven charting, replay, and simulation into one focused futures workspace.
01 / THE DATA DIFFERENCE
A one-second OHLC bar summarizes the price range. Tick data retains the supplied trades behind that range—so activity, sequence, and price-level volume can shape the chart.
Open, high, low, and close describe the interval. They cannot reconstruct the original trade count or the order of trades within it.
Individual supplied trades drive tick candles and trade-based session calculations. Tick charts reject OHLC projections instead of treating them as real trades.
Input-method comparison, not a claim that every competing platform uses bar-only data. Diagrams are illustrative. Historical time charts can load candle snapshots; tick charts and recorded-tick replay use actual trade data.
Build tick bars from trade counts, rather than reconstructing activity from timed summaries.
Calculate session VWAP and volume profile from ingested trades and their reported volume.
Revisit recorded ticks, pause the market, and step through price action at your own pace.
02 / INSIDE LASER
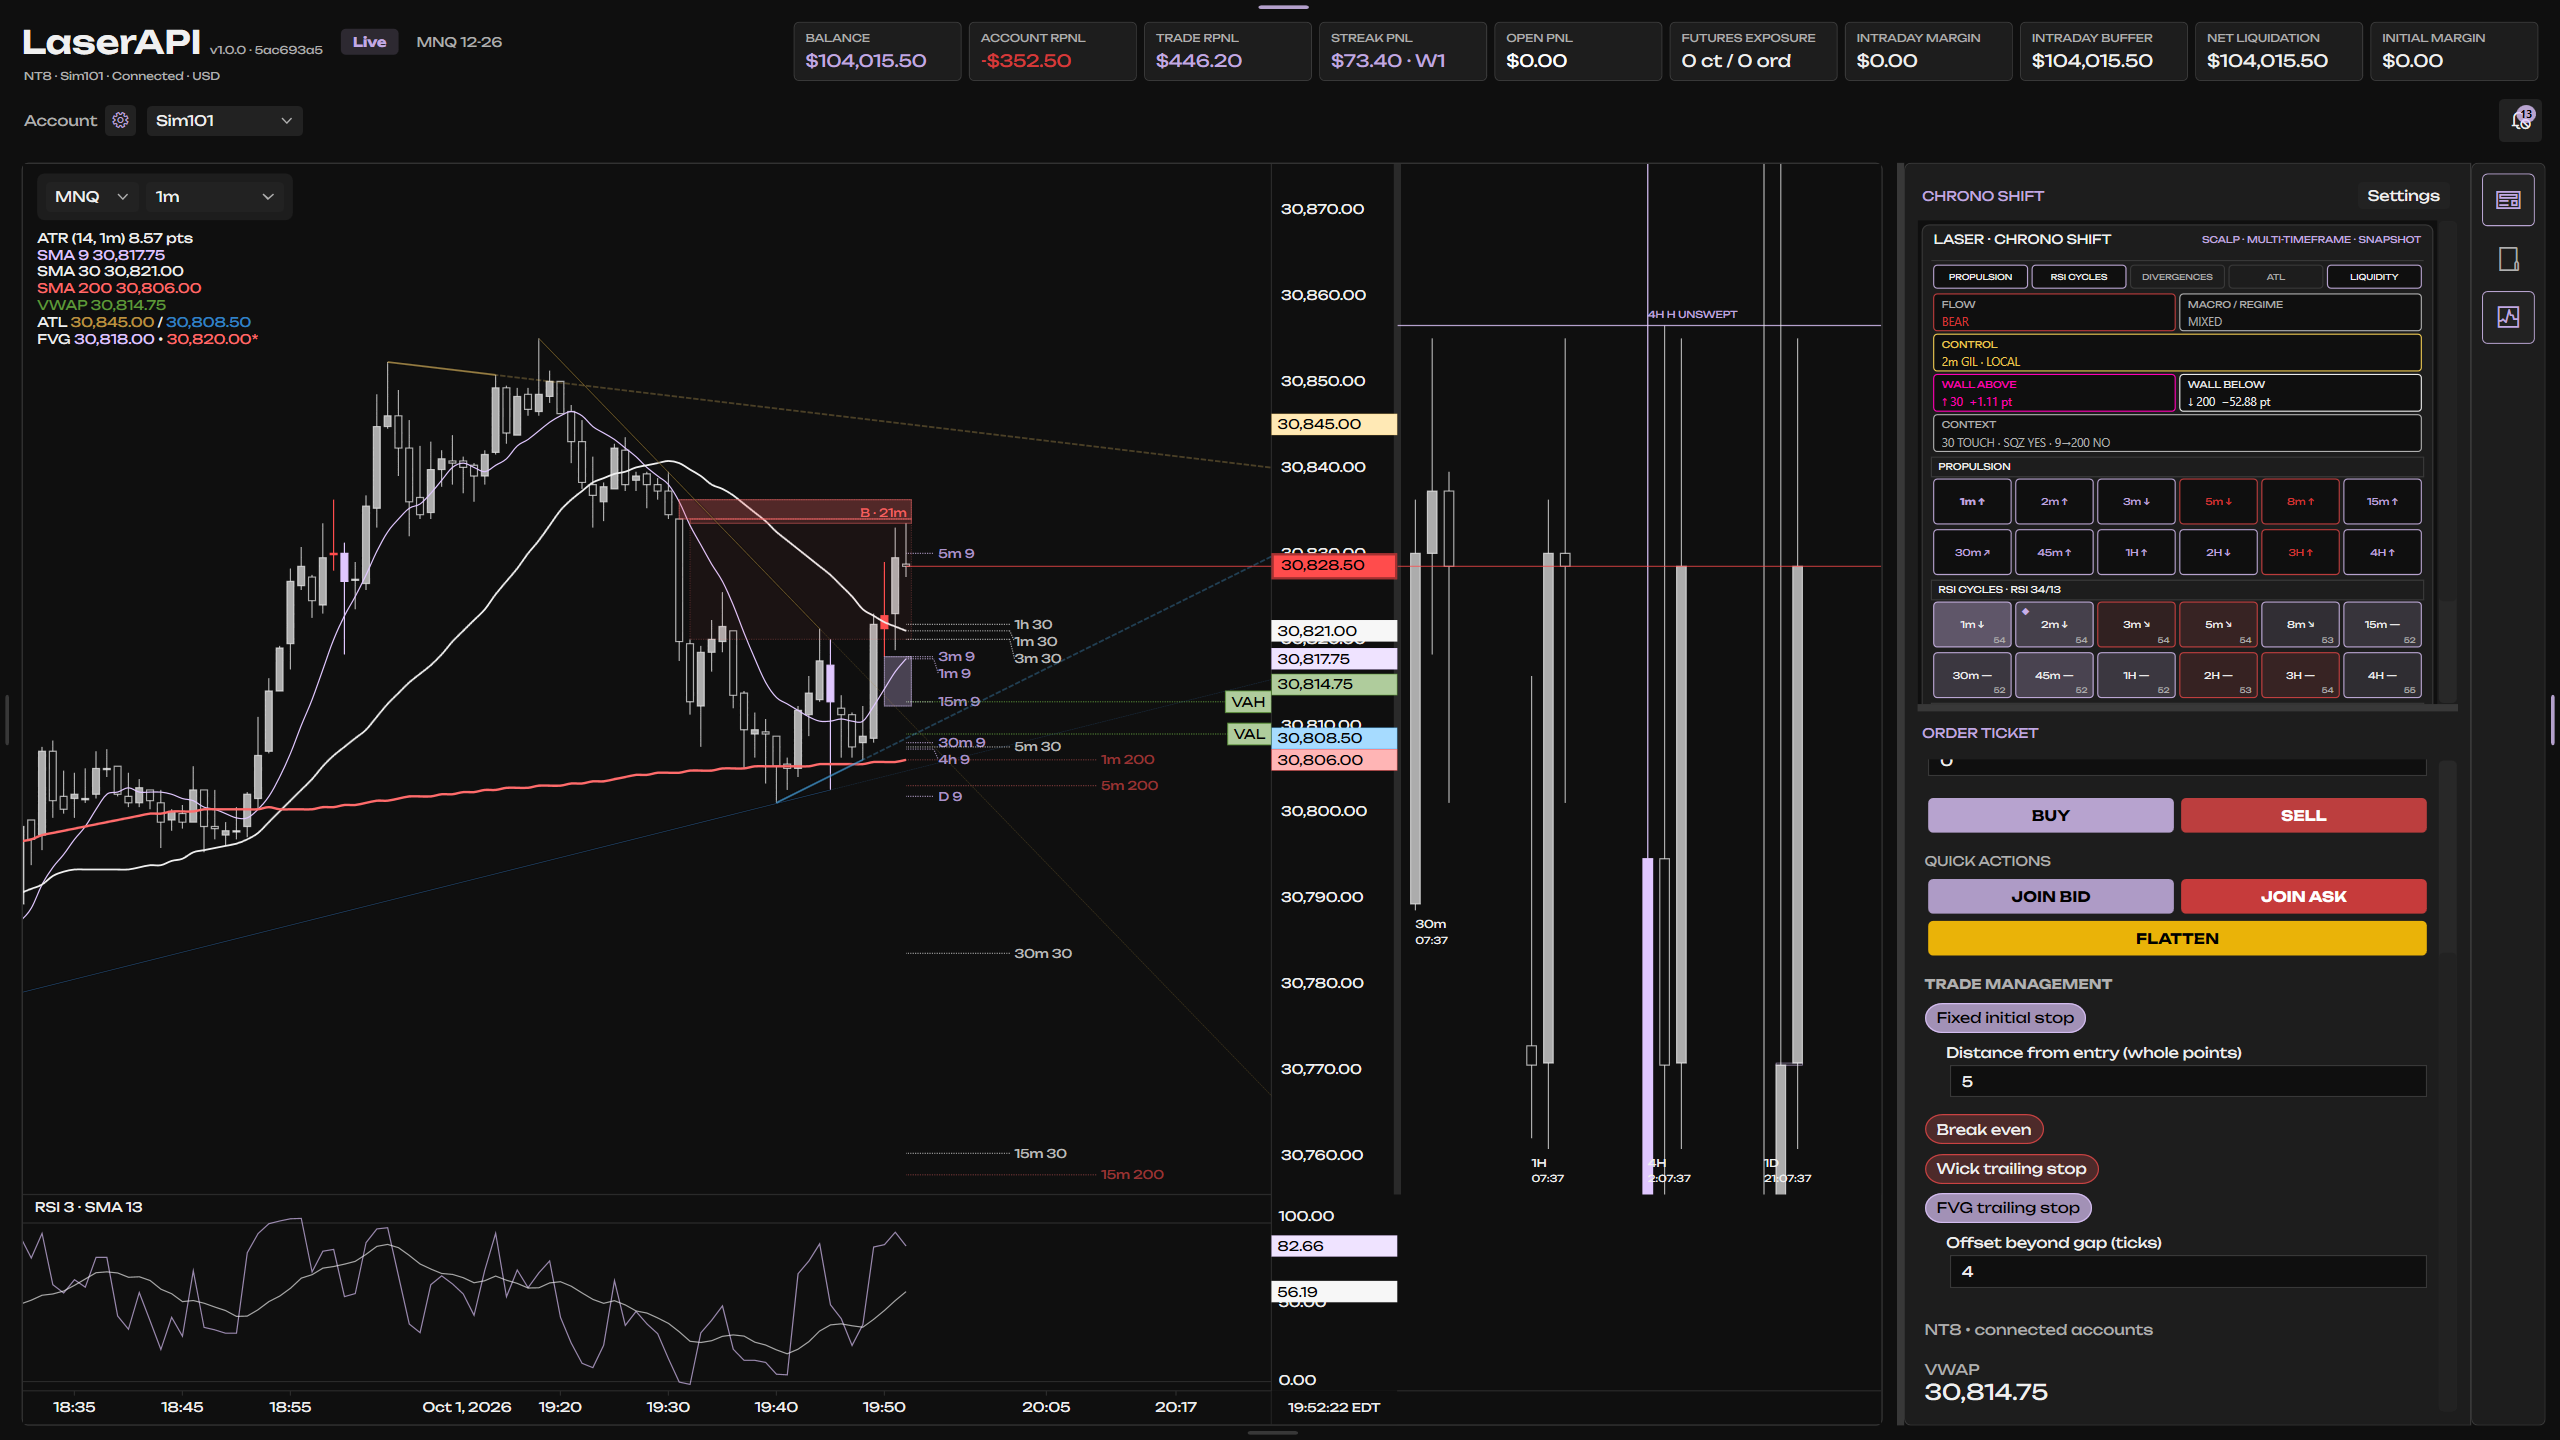
Chart layers, trade annotations, and multi-timeframe analysis stay close to the price action.

Indicator overlays and simulation trade controls on the chart. Preview capture; displayed PnL is not a performance claim.

A focused view of flow, RSI cycles, and divergence context. Development preview.
03 / DOWNLOAD LASER
The Windows desktop engine, ready to explore.
Windows x64 · Preparing release
Checking the latest engine version…